

How much do TikTok Shop sellers make? In October 2026, the median high volume US shop sold about 42,456 units and made $1.00 million in GMV, with the middle half between $557K and $1.94 millionS1. That range comes from 498 of 500 high volume US shops in the FastMoss October 2026 shop ranking, each selling at least 26,919 units that month.
This page is about ranges. If you want the named list of the biggest shops, the October 2026 top sellers post has it. Here you will find what a typical shop in that ranking sold, how that changes by category, and how much more it took to make the list in October than in September.
See US shop GMV ranges in FastMoss and filter the monthly shop ranking by category or shop type.
How much do TikTok Shop sellers make in 2026?
The median shop in this October 2026 sample made $1.00 million in GMV and sold 42,456 unitsS1. Half of the 498 shops landed between $557K and $1.94 million. The top 10% made $3.39 million or more, and the bottom 10% made $319K or less.
Every shop in the sample sold at least 26,919 units in the month. Together the 500 shops sold 30,440,211 units, or 30.5% of the 99,646,413 units sold on US TikTok Shop in OctoberS1S2. So these are high volume shops, and most US sellers are smaller than every shop on this page.
| Measure, October 2026 | Units sold | GMV |
|---|---|---|
| 10th percentile | 28,837 | $319K |
| 25th percentile | 33,315 | $557K |
| Median | 42,456 | $1.00 million |
| 75th percentile | 60,174 | $1.94 million |
| 90th percentile | 104,782 | $3.39 million |
GMV per unit tells you why two shops with the same units can sit far apart. The median shop took in $22.45 of GMV per unit sold, and the middle half ran from $13.20 to $34.09S1. A shop selling $10 items needs about three times the orders of a shop selling $30 items to reach the same GMV.
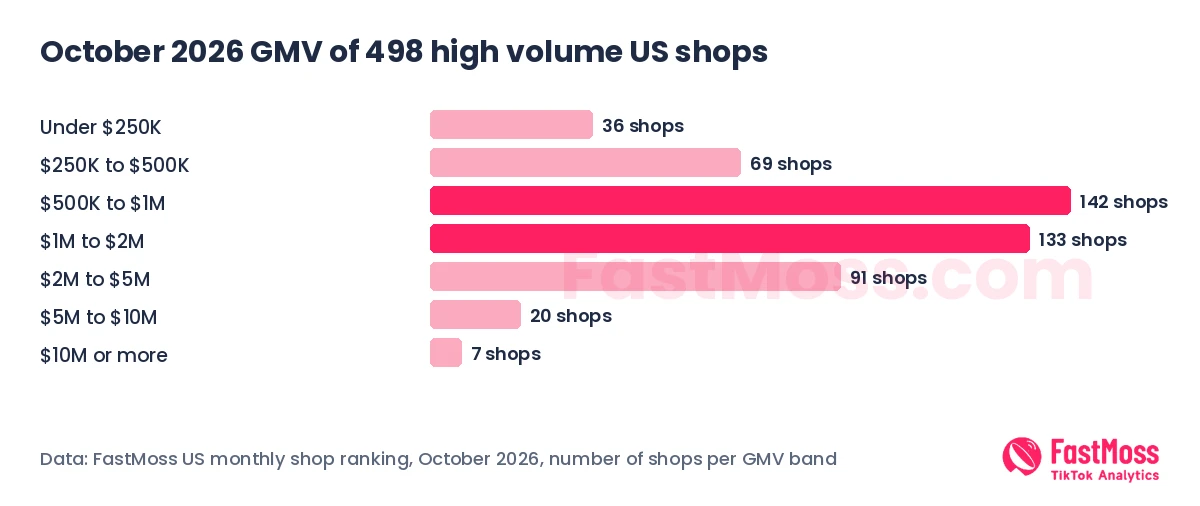
| October 2026 GMV | Shops | Share of shops |
|---|---|---|
| $10M or more | 7 | 1.4% |
| $5M or more | 27 | 5.4% |
| $2M or more | 118 | 23.7% |
| $1M or more | 251 | 50.4% |
| $500K or more | 393 | 78.9% |
| Under $250K | 36 | 7.2% |
Bottom line: a typical high volume US shop in this ranking made about $1 million in GMV in October 2026, and only 27 of 498 passed $5 million.
What GMV ranges show up by category?
Health and Menswear shops had the highest typical GMV, with medians of $1.67 million and $1.64 million. Toys and Hobbies had the lowest at $306K, even though its median shop sold 38,734 unitsS1. The table covers the 10 categories with at least 15 shops in the sample. Each shop is counted under its main category.
| Main category | Shops | Median units | 25th percentile GMV | Median GMV | 75th percentile GMV |
|---|---|---|---|---|---|
| Health | 25 | 51,053 | $1.04 million | $1.67 million | $2.14 million |
| Menswear and Underwear | 17 | 42,982 | $961K | $1.64 million | $2.07 million |
| Womenswear and Underwear | 82 | 46,055 | $897K | $1.32 million | $2.29 million |
| Sports and Outdoor | 20 | 52,179 | $701K | $1.06 million | $2.43 million |
| Beauty and Personal Care | 142 | 45,773 | $576K | $1.04 million | $1.93 million |
| Collectibles | 21 | 38,313 | $269K | $753K | $1.61 million |
| Phones and Electronics | 18 | 36,922 | $483K | $676K | $1.21 million |
| Fashion Accessories | 28 | 38,106 | $393K | $589K | $1.55 million |
| Home Supplies | 25 | 37,566 | $425K | $559K | $895K |
| Toys and Hobbies | 20 | 38,734 | $173K | $306K | $770K |
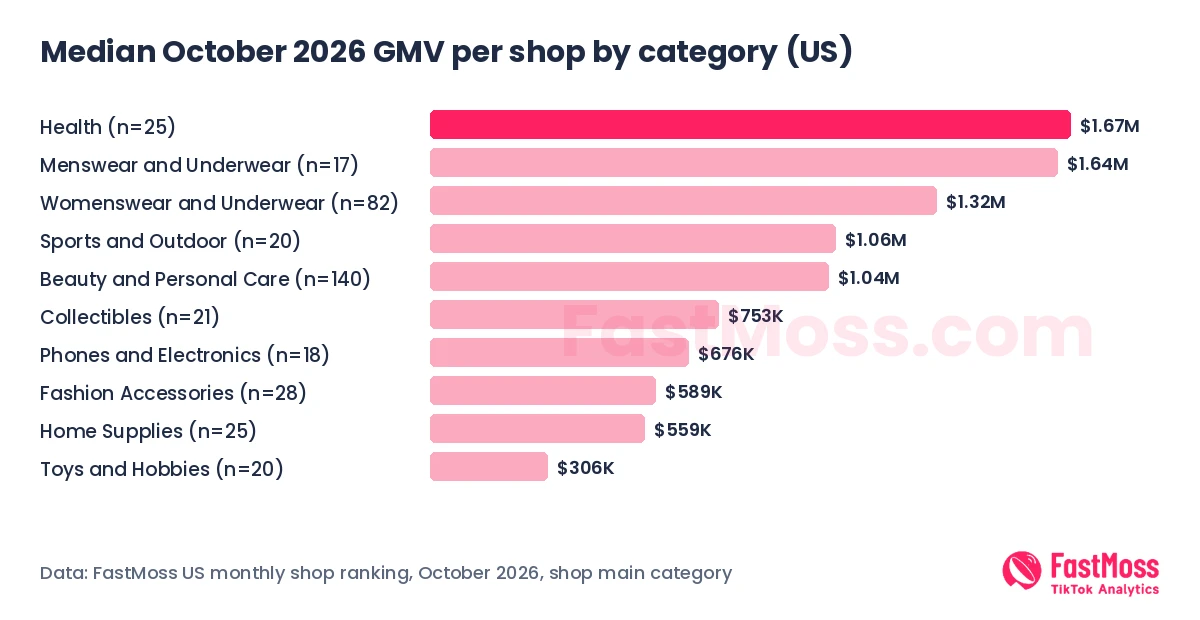
Beauty and Personal Care is the biggest group with 142 shops, and its median of $1.04 million sits right on the overall median. Womenswear and Underwear is next with 82 shops and a higher median of $1.32 million. Home Supplies, Fashion Accessories and Phones and Electronics shops sold similar units to the others but at lower prices, so their medians stayed under $700K.
Cross border shops made up 179 of the 500. Their median GMV was $894K on 39,330 units, against $1.11 million on 43,606 units for local US shopsS1.
Bottom line: category moves the typical GMV more than units do, so compare a shop with others in its own category before you judge it.
What does a shop at each GMV level look like?
Shops at the same GMV can run very different businesses. These are real shops from the October 2026 sample, shown without names because the point is the patternS1.
- Near the 25th percentile: a cross border Home Supplies shop made $559K in GMV on 27,297 units with only 9 products selling. A local Beauty shop made $557K on 54,017 units, at $10.31 per unit across 94 products.
- Near the median: a cross border Toys and Hobbies shop made $1.01 million on 92,494 units, about $10.87 per unit. A local Fashion Accessories shop made $1.00 million on 28,839 units, about $34.69 per unit. Same GMV, more than three times the units.
- Near the 75th percentile: two local Beauty shops each made about $1.94 million. One sold 116,868 units with 30 linked creators. The other sold 46,627 units at $41.48 per unit with 24,878 linked creators.
So a GMV figure alone does not tell you how a shop sells. Price per unit, the number of products with sales and the number of creators linked to the shop all change what the same monthly GMV looks like in practice.
Bottom line: read units, price per unit and creator count together with GMV before you compare your shop with any number on this page.
How does a typical shop compare with the top sellers?
The gap is wide. The shop at rank 10 by units sold 249,463 units in October 2026, about 5.9 times the median shop in this sampleS1. Only 7 shops cleared $10 million in GMV, while 251 cleared $1 million.
Names and full rankings live in other posts. The October 2026 top 20 shops by units lists the leaders for the same month, and the Q1 2026 top 10 US sellers post covers the leaders earlier in the year. This page keeps to ranges so you can place a shop that is not on any leaderboard.
Open the FastMoss shop ranking to see where a shop you follow sits by units and GMV this month.
Bottom line: the named leaderboard lives on the October top sellers post, and this page stays on the typical range below it.
Did typical shop GMV change from September to October 2026?
Yes, the bar went up. The shop at rank 500 by units sold 27,132 units in October, up 18.8% from 22,829 at the same rank in SeptemberS1. Lower ranks rose faster than the top: rank 10 needed 11.1% more units, rank 100 needed 13.7% more and rank 250 needed 17.8% more.
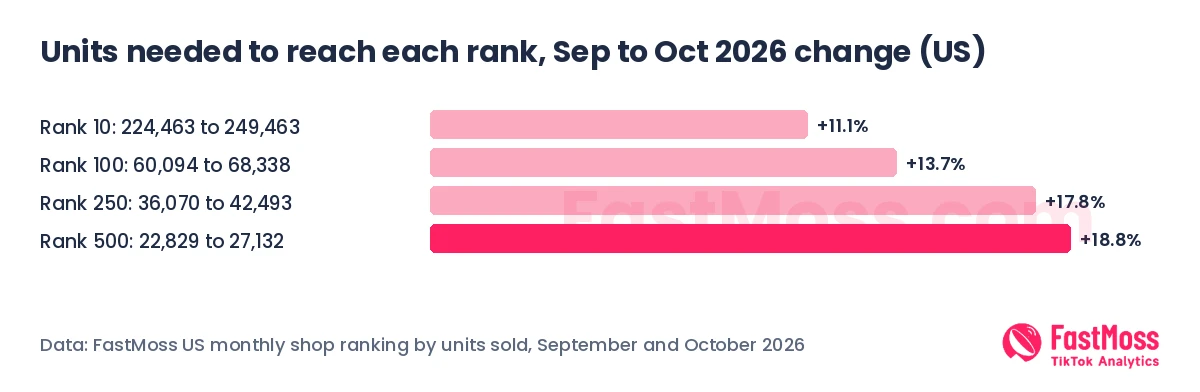
The whole US market grew too. Units sold rose 12.7%, from 88,422,696 in September to 99,646,413 in October, and GMV rose 22.5%, from $2.46 billion to $3.02 billionS2. Both changes are computed from the two full months. A median GMV for the September top 500 was not retrieved, so this page compares units at fixed ranks. For more September figures, see the September 2026 US TikTok Shop statistics.
Bottom line: it took more units to reach the same rank in October than in September, and the change is computed from two named monthly bases.
How can you look up one shop’s GMV?
Use the shop search in FastMoss and read the shop’s monthly units and GMV. The guide to checking a TikTok Shop GMV walks through each step, so this page does not repeat them. Once you have a shop’s October figures, place it against the percentile table above and the row for its category.
Remember that GMV is the value of orders, before platform fees, creator commission, shipping and returns. The US seller costs and fees guide breaks down what comes out of GMV before a seller sees profit.
Bottom line: use the GMV lookup guide for a single shop, and use this page for the market range around it.
How was this TikTok Shop seller data collected?
FastMoss tracks TikTok Shop in 20 markets, and this page uses only the US. The sample is the FastMoss US monthly shop ranking for October 2026: 500 shops, each with at least 26,919 units sold in the monthS1. GMV and units are FastMoss estimates for full calendar months, with no single day figures.
Two shops were left out of the GMV figures because their October GMV did not match their units. One showed GMV per unit far above anything it sold in September, and the other was a skincare shop at $276 of GMV per unit. Both stay in the units figures. Month to month changes are computed from the September and October totals, not taken from any ready made growth field.
Bottom line: every number here is a FastMoss estimate for full months of US data, and the sample is 500 high volume US shops from the FastMoss shop ranking, not all sellers.
Browse the FastMoss shop ranking
FAQ
How much do TikTok Shop sellers make in the US?
In October 2026, the median high volume US shop made $1.00 million in GMV on about 42,456 units. The middle half of 498 shops made between $557K and $1.94 millionS1. These are 500 high volume US shops in the FastMoss October 2026 shop ranking, each selling at least 26,919 units, so most sellers make less.
Is TikTok Shop selling worth it in 2026?
It depends on your category, price and costs. US units sold grew 12.7% from September to October 2026S2, but the shops on this page are 500 high volume shops, and GMV is not profit. Check fees and creator commission in the US seller costs guide before you decide.
Is TikTok Shop good for sellers in every category?
No. Median shop GMV in October 2026 ranged from $1.67 million in Health to $306K in Toys and Hobbies among high volume US shopsS1. Categories with fewer than 15 shops in the sample are not shown.
Are these figures average seller income?
No. They are monthly GMV for 500 high volume US shops in the FastMoss October 2026 shop ranking, each selling at least 26,919 units. GMV is the order value before fees, commission, shipping and returns, so it is not income or profit.
Where can I see the top US shops for October 2026?
The October 2026 top sellers post lists the top 20 US shops by units sold. This page covers the typical range below those leaders.
How do I check one shop’s GMV in FastMoss?
Search for the shop in FastMoss and open its monthly data. The TikTok Shop GMV guide shows each step. FastMoss tracks TikTok Shop in 20 markets.
Sources
- S1. FastMoss.com, US monthly shop ranking, October 2026 (500 shops, sorted by GMV) and September and October 2026 (sorted by units sold, ranks 1 to 10, 91 to 100, 241 to 250 and 491 to 500), FastMoss estimates, retrieved November 16, 2026.
- S2. FastMoss.com, US market basic metrics, all categories, September and October 2026, FastMoss estimates, retrieved November 16, 2026.