
By Chufan Shi, US GM, FastMoss.
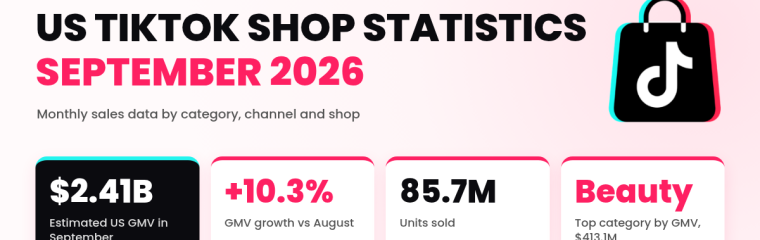
US TikTok Shop sales reached an estimated $2.41 billion in gross merchandise value (GMV) on 85.7 million units in September 2026, up 10.3% in GMV from August even as units fell 4.0%. Beauty and Personal Care was the largest US category by both GMV and units, with Womenswear and Underwear in second place. These TikTok Shop statistics summarize the US market for the full calendar month, with every figure drawn from public TikTok Shop data tracked by FastMoss. The tables below break out sales by category, by channel, and by shop, and every section and table has a stable link so you can cite any part directly.
Want to work with the underlying numbers? Open FastMoss product search to see units sold and commission rates for US products.
US TikTok Shop statistics: September 2026 at a glance
Spending rose while volume eased. GMV grew because the average selling price moved up from $24.52 in August to $28.16 in September, which more than offset the drop in units. The count of creators who sold at least one product and the count of selling LIVE sessions both rose, while the number of shoppable videos fell.
| Metric | September 2026 | August 2026 | Change |
|---|---|---|---|
| Estimated GMV | $2.41B | $2.19B | +10.3% |
| Units sold | 85.7M | 89.3M | -4.0% |
| Average selling price | $28.16 | $24.52 | +$3.64 |
| Active products | 2.26M | 2.30M | -1.3% |
| Selling creators | 676,170 | 660,581 | +2.4% |
| Shoppable videos | 9.06M | 9.91M | -8.6% |
| Selling LIVE sessions | 487,044 | 474,184 | +2.7% |
Source: FastMoss, US TikTok Shop data, September 2026. GMV and units are estimates. Month-over-month change is computed from raw monthly totals.
For the full-year view behind these monthly numbers, see our 2025 US TikTok Shop sales recap.
Top categories
The table below ranks the top 10 US categories by units sold and shows GMV, share of total US GMV, average selling price (ASP), the GMV change versus August, and the share of category units that flowed through each category’s 10 largest shops.
The largest categories by GMV and units
Beauty and Personal Care was the largest category on both measures, at $413.1M of GMV and about 17.5M units, which is 17.1% of all US GMV. Womenswear and Underwear was second, at $336.0M and 12.5M units. Among the top 10 by units, Collectibles had the highest average selling price at $52.65, while Home Supplies and Toys and Hobbies sat below $20.
| Rank by units | Category | GMV | Share of US GMV | Units | ASP | GMV vs Aug | Top 10 shops, units share |
|---|---|---|---|---|---|---|---|
| 1 | Beauty and Personal Care | $413.1M | 17.1% | 17.5M | $23.64 | +10.6% | 21.9% |
| 2 | Womenswear and Underwear | $336.0M | 13.9% | 12.5M | $26.94 | +19.2% | 16.1% |
| 3 | Fashion Accessories | $141.3M | 5.9% | 6.0M | $23.44 | +6.0% | 14.2% |
| 4 | Sports and Outdoor | $178.9M | 7.4% | 5.3M | $33.97 | +2.1% | 20.3% |
| 5 | Home Supplies | $104.6M | 4.3% | 5.6M | $18.77 | +10.8% | 18.7% |
| 6 | Phones and Electronics | $108.5M | 4.5% | 4.2M | $25.74 | +0.2% | 14.5% |
| 7 | Menswear and Underwear | $114.3M | 4.7% | 4.1M | $27.86 | +0.9% | 16.7% |
| 8 | Health | $111.6M | 4.6% | 3.8M | $29.04 | +4.3% | 28.4% |
| 9 | Collectibles | $123.0M | 5.1% | 2.3M | $52.65 | +30.2% | 16.3% |
| 10 | Toys and Hobbies | $51.3M | 2.1% | 2.6M | $19.85 | +16.5% | 19.8% |
Source: FastMoss, US TikTok Shop data, September 2026. Ranked by units sold. GMV, units and ASP are estimates, so the rank order and the per-category unit estimate can differ by a small margin near ties.
How concentrated each category is
No category in the top 10 was controlled by its largest shops. The 10 biggest shops in each category took between 14.2% of units in Fashion Accessories and 28.4% in Health, so sales stayed spread across many sellers. Among the fast movers, Collectibles GMV rose 30.2% versus August and Womenswear and Underwear rose 19.2%. To spot categories gaining momentum, see how to find trending products on TikTok Shop.
How shoppers buy: video, LIVE and other
Most big categories sold mainly through video, with a smaller slice from LIVE and the rest from “Other,” which covers the product card, search, the shop page and similar non-content traffic. The exceptions are the LIVE-heavy categories. Collectibles ran at 31.3% LIVE and only 1.8% video, and Jewelry Accessories and Derivatives ran at 26.5% LIVE. Every category we tracked saw LIVE lose share of GMV versus August. The largest drop was Collectibles, down 22.9 points to 31.3%.
| Category | Video % | LIVE % | Other % | LIVE change vs Aug (pts) |
|---|---|---|---|---|
| Beauty and Personal Care | 51.3% | 10.1% | 38.6% | -7.8 |
| Womenswear and Underwear | 57.1% | 4.3% | 38.6% | -7.3 |
| Fashion Accessories | 38.7% | 6.4% | 54.9% | -6.1 |
| Sports and Outdoor | 53.4% | 4.9% | 41.7% | -3.3 |
| Home Supplies | 49.8% | 3.3% | 46.9% | -4.2 |
| Phones and Electronics | 50.2% | 8.7% | 41.1% | -3.6 |
| Menswear and Underwear | 55.6% | 3.4% | 41.0% | -2.7 |
| Health | 46.8% | 4.7% | 48.5% | -8.1 |
| Collectibles | 1.8% | 31.3% | 66.9% | -22.9 |
| Toys and Hobbies | 45.3% | 7.6% | 47.2% | -5.0 |
| Jewelry Accessories and Derivatives | 13.1% | 26.5% | 60.5% | -4.4 |
| Furniture | 48.8% | 2.4% | 48.8% | -2.3 |
Source: FastMoss, US TikTok Shop data, September 2026. Shares are of category GMV and are estimates. “Other” covers the product card, search, the shop page and similar non-content traffic.
Top 10 shops
The 10 largest shops by GMV spanned beauty, apparel, home and collectibles. medicube US Store led at an estimated $19.65M, ahead of QVC and Comfrt. IG Crystal entered the list on a very large monthly jump, which we mark as n/m because its August base was too small for a meaningful comparison.
| Rank | Shop | Main category | GMV | Units | GMV vs Aug | Linked creators |
|---|---|---|---|---|---|---|
| 1 | medicube US Store | Beauty and Personal Care | $19.65M | 632,991 | -2.0% | 215,617 |
| 2 | QVC, Inc | Household Appliances | $14.08M | 245,000 | +30.6% | 129,647 |
| 3 | Comfrt | Womenswear and Underwear | $12.38M | 285,815 | +12.2% | 108,011 |
| 4 | Dr.Melaxin | Beauty and Personal Care | $10.78M | 389,938 | -8.3% | 109,695 |
| 5 | VEVOR Store | Tools and Hardware | $10.67M | 148,399 | +27.1% | 36,746 |
| 6 | IG Crystal | Collectibles | $10.04M | 47,649 | n/m | 635 |
| 7 | Halara US | Sports and Outdoor | $9.79M | 265,320 | +13.7% | 21,145 |
| 8 | Shark Home | Household Appliances | $9.73M | 45,349 | -5.8% | 19,932 |
| 9 | Tarte Cosmetics | Beauty and Personal Care | $8.77M | 236,377 | -2.7% | 64,796 |
| 10 | Mellow Sleep | Textiles and Soft Furnishings | $8.20M | 145,912 | +11.9% | 49,771 |
Source: FastMoss, US TikTok Shop data, September 2026. GMV and units are estimates. n/m: August base too small to compare.
Top 10 products
The best-selling products by GMV were led by the medicube Smooth and Clear Body Care Set at an estimated $4.92M. Four of the top 10 were beauty products. Prices ranged from about $23 to $999, and commission rates ran from 2% to 25%.
| Rank | Product | Shop | Category | GMV | Units | Price | Commission | Units vs Aug |
|---|---|---|---|---|---|---|---|---|
| 1 | medicube Smooth and Clear Body Care Set | medicube US Store | Beauty and Personal Care | $4.92M | 155,387 | $40.30 to $110.50 | 15% | +164.1% |
| 2 | Wild Card Matte Player Pack trading cards | Final Score Collectibles | Collectibles | $2.88M | 2,884 | $999.00 | 2% | +16.0% |
| 3 | Comfrt The Dreamer Blanket | Comfrt | Textiles and Soft Furnishings | $2.70M | 28,050 | $123.50 to $258.70 | 10% | +5.3% |
| 4 | Warranty card listing | Cassandra Sells Clothes | Sports and Outdoor | $2.06M | 11,130 | $199.00 | 10% | -21.7% |
| 5 | Voyage Nova Rosey Fruity Floral Extrait de Parfum | QAWAFI | Beauty and Personal Care | $2.05M | 77,411 | $25.20 to $34.90 | 15% | +15.0% |
| 6 | BEDLORE Bamboo Cooling Mattress Topper | Bedlore | Furniture | $2.04M | 58,783 | $36.00 to $64.00 | 13% | -0.9% |
| 7 | Shark StainForce Cordless Portable Stain Cleaner | Shark Home | Household Appliances | $2.02M | 10,770 | $220.99 | 5% | +5.0% |
| 8 | Toplux Magnesium Complex Supplement | Toplux Nutrition | Health | $1.99M | 107,844 | $23.36 | 25% | -31.0% |
| 9 | Sungboon EGF Tox Toner | SUNGBOON EDITOR | Beauty and Personal Care | $1.94M | 75,257 | $24.30 | 15% | +157.7% |
| 10 | EPAIS Essential Eyelash Growth Serum | epais | Beauty and Personal Care | $1.92M | 82,316 | $30.00 to $60.00 | 15% | +114.0% |
Source: FastMoss, US TikTok Shop data, September 2026. GMV and units are estimates. The rank 4 entry is the listing name as shown on TikTok Shop. Commission rates are as listed.
To check any one product’s sales for yourself, read how to access TikTok Shop data.
Open FastMoss product search to pull the videos and creators behind any of these products.
Who drives sales: creators
In September, 676,170 creators sold at least one product, across 9.06 million shoppable videos and 487,044 selling LIVE sessions. LIVE drove the top of the ranking. Nine of the top 10 creators by GMV earned at least 97% of it from LIVE, and the exception was QVC at 64%. Several of the names are brand or shop accounts rather than individual creators, including medicube, Dr. Squatch, QVC and CANVAS BEAUTY BRAND. The follower-tier view of creator sales is held back this month (see methodology).
| Rank | Handle | Followers | GMV | LIVE share | LIVE sessions |
|---|---|---|---|---|---|
| 1 | @based | 4,548,125 | $6.35M | 97% | 13 |
| 2 | @jmuthkfs | 26,900 | $4.29M | 100% | 15 |
| 3 | @sunnyslumber | 59,281 | $2.86M | 100% | 72 |
| 4 | @drsquatch | 1,850,422 | $2.83M | 97% | 41 |
| 5 | @milwaukeedailydeals | 52,766 | $2.83M | 100% | 29 |
| 6 | medicube US Store (shop account) | 718,707 | $2.05M | 98% | 19 |
| 7 | @allpoketcg | 472,352 | $1.88M | 100% | 22 |
| 8 | @canvasbeautybrand | 101,470 | $1.54M | 99% | 2 |
| 9 | @qvc | 1,602,341 | $1.40M | 64% | 138 |
| 10 | @silhouette.paris | 130,444 | $1.31M | 100% | 68 |
Source: FastMoss, US TikTok Shop data, September 2026. GMV is an estimate. LIVE share is the share of the creator’s GMV that came from LIVE.
Category spotlights
Beauty and Personal Care
Beauty and Personal Care was the largest US category, at an estimated $413.1M of GMV and about 17.5M units, which is 17.1% of all US GMV. GMV rose 10.6% versus August. The category listed 227,394 active products and drew 306,158 selling creators. By units, the biggest subcategories were Makeup at 4.43M, Skincare at 3.20M, Perfume at 2.23M, Bath and Body Care at 2.05M, and Haircare and Styling at 1.94M. LIVE mattered more in some of these than in others, with Perfume at 18.7% of GMV from LIVE, Makeup at 18.0%, and Skincare at 5.1%. The largest beauty shops were medicube US Store at $19.65M (down 2.0% versus August), Dr.Melaxin at $10.78M (down 8.3%), and Tarte Cosmetics at $8.77M (down 2.7%). Four of the top 10 US products overall were beauty products.
On price, the $20 to $30 band held the largest share of beauty GMV, at 22.1%, or $91.3M. The $5 to $10 band told the opposite story, holding 19.9% of active products but only 3.8% of GMV.
| Price band | Share of active products | Share of category GMV | GMV |
|---|---|---|---|
| Up to $5 | 14.9% | 2.5% | $10.1M |
| $5 to $10 | 19.9% | 3.8% | $15.6M |
| $10 to $15 | 16.5% | 10.2% | $42.1M |
| $15 to $20 | 11.5% | 13.5% | $55.9M |
| $20 to $30 | 14.2% | 22.1% | $91.3M |
| $30 to $40 | 8.4% | 14.0% | $57.8M |
| $40 to $60 | 7.3% | 14.6% | $60.2M |
| $60 to $80 | 3.0% | 6.9% | $28.5M |
| $80 to $100 | 1.6% | 3.3% | $13.7M |
| Over $100 | 2.7% | 9.1% | $37.7M |
Source: FastMoss, US TikTok Shop data, Beauty and Personal Care, September 2026. Shares are estimates and may not add to exactly 100% because of rounding. Bands include the upper bound, so $20 to $30 covers prices above $20 up to $30.
Jewelry
Jewelry Accessories and Derivatives reached an estimated $43.4M of GMV on 1,066,972 units, at an average selling price of $40.64. GMV rose 39.9% versus August, the fastest month-over-month growth of the categories we tracked this month. The channel mix leaned away from video: 26.5% of GMV came from LIVE, 13.1% from video, and 60.5% from the product card, search and other non-content traffic. The 10 largest shops took 30.5% of category units. This figure covers the Jewelry Accessories and Derivatives category only. Costume jewelry that sells under Fashion Accessories is not included here.
Methodology and how to cite
The GMV and unit figures in this report are estimates that FastMoss builds from public TikTok Shop data. They cover the US market for the calendar month of September 1 to 30, 2026, and were pulled on October 23, 2026. Month-over-month change is computed from raw monthly totals for each metric. Where a table shows a channel split, “Other” covers the product card, search, the shop page and similar non-content traffic rather than video or LIVE.
Category GMV comes from 17 of the 30 level-1 categories, which together account for $2.08B of the $2.41B total. The other 13 categories add up to $332.9M, less than either Beauty and Personal Care or Womenswear and Underwear, which is how we confirm those two as the largest by GMV. When this report says “categories we tracked,” it means those 17. Five items are held back this month. (a) The creator follower-tier breakdown is not shown because its creator counts and unit counts do not reconcile with the selling-creator and unit totals reported above. (b) A product-count field and a concentration metric did not pass our checks, so they are not used. (c) The shop-level channel split is only available as rolling 7, 28 and 90 day windows rather than calendar months, so it is not used. (d) Year-over-year growth is left out because the reported year-over-year figures do not match the growth recomputed from September 2025 totals. (e) A selling-video-count change field was wrong, so the month-over-month change reported above is computed from monthly totals instead.
You are welcome to cite this report with credit. Source: FastMoss, US TikTok Shop data, September 2026. Looking ahead to the holidays, see our guide on TikTok Shop Black Friday 2026 and what to sell.
FAQ
How big was US TikTok Shop in September 2026?
US TikTok Shop generated an estimated $2.41 billion in GMV on 85.7 million units in September 2026, up 10.3% in GMV from August. The average selling price was $28.16.
Which category sells the most on US TikTok Shop?
Beauty and Personal Care was the largest US category in September 2026 by both GMV and units, at an estimated $413.1M and about 17.5M units, which is 17.1% of all US GMV. Womenswear and Underwear was second, at $336.0M.
Where does this TikTok Shop data come from?
The figures are FastMoss estimates built from public TikTok Shop data for the US market, covering September 1 to 30, 2026, and pulled on October 23, 2026. GMV and units are estimates rather than figures reported by TikTok.
See the products and creators behind these numbers
Filter US products by category, commission rate and units sold, then open each one to see the videos and creators that sell it.