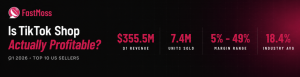
Quick Answer: TikTok Shop US generated $15.1 billion in 2025 GMV — up 68% year-over-year — but profitability is the harder question. Based on FastMoss Q1 2026 data from the Top 10 US sellers ($355.5M combined revenue, 7.4M units sold) and TikTok’s published fee structure, estimated net margins for these elite sellers range from 5% on the low end to 49% on the high end, depending on category, AOV, and creator strategy. The industry-wide average sits at just 18.4% — and most TikTok Shop sellers are well below that.
Last updated: June 6, 2026 · Data sourced from FastMoss
Why Profitability Is Now the #1 Question on TikTok Shop
The GMV growth headlines are no longer in question. According to EMARKETER’s June 2026 outlook, TikTok Shop US sales are expected to reach $23.41 billion in 2026 — a 48% year-over-year increase that would put the platform ahead of Target, Costco, and Best Buy in US e-commerce volume.
But behind the growth story sits a less-discussed reality: more than 50% of TikTok Shops are inactive, and fewer than 10% of new sellers survive their first year. The industry-wide average active US TikTok Shop seller nets approximately $690 per month on $3,750 in sales — an 18.4% net margin after all fees and costs.
So the question that matters in 2026 isn’t whether TikTok Shop is growing. It’s: under what conditions does TikTok Shop actually become profitable?
This analysis answers that by looking at the Top 10 US sellers in Q1 2026 — sellers who have already solved the volume problem — and asking how their cost structures, AOV, and creator strategies translate into margin reality.
About This Analysis
- Time window: Q1 2026 (January, February, March)
- Sample: Top 10 US TikTok Shops by combined Q1 revenue
- Data source: FastMoss — TikTok Shop’s leading third-party analytics platform (revenue, units sold, creator network, product count)
- Industry benchmarks: TikTok Shop published fee structure; EMARKETER (June 2026); Branvas/Dashboardly 2026 seller profitability tracking
- Margin methodology: Fully disclosed formula below — we publish low and high estimates rather than single point figures, because actual seller costs vary significantly within each cost category
The 5 Cost Components Every TikTok Shop Seller Pays
Before looking at the Top 10, here are the five cost categories that determine TikTok Shop profitability for every seller on the platform:
1. Platform commission and processing: 5–9%
TikTok Shop charges a referral fee on every transaction. The base rate is approximately 5–8% for most categories on the US platform, with payment processing adding another 1–2%. This is non-negotiable and applies to every sale.
2. Creator affiliate commission: 5–30%
Sellers set the commission rate they pay to affiliate creators per sale. Across FastMoss’s tracked product universe, rates cluster in the 5–15% range for established brands and 20–30% for newer brands aggressively recruiting creators. This is the most variable cost category — and the lever that defines a seller’s growth strategy.
3. Fulfillment: 11–14% of order value (for low-AOV products)
The Fulfilled by TikTok (FBT) program charges $2.86 to $3.58 per unit. For a $25 product, that’s 11–14% of revenue gone before any other cost. Since independent shipping ended March 31, 2026, FBT is effectively mandatory for most sellers — making AOV one of the strongest determinants of margin.
4. Returns: 5–12% of revenue
Return rates on TikTok Shop run higher than traditional e-commerce because impulse purchases drive a significant share of sales. Return shipping costs the seller 20% of the return shipping fee if Shop Performance Score is 4 or above, and 50% if below 4 — making the Shop Rating directly tied to margin.
5. Ad spend (GMV Max and others): 8–20% of GMV
Top sellers typically reinvest 10–20% of GMV into TikTok’s GMV Max ad product to maintain ranking and drive incremental sales. Newer or scaling sellers often spend higher percentages while established brands with strong organic creator networks spend less.
Our Profitability Formula (Fully Transparent)
Across every shop in the Top 10, we apply the same disclosed formula to estimate gross margin ranges:
| Cost Category | Low Estimate (Optimistic) | High Estimate (Conservative) | Source |
|---|---|---|---|
| Platform + processing | 5% | 5% | TikTok Shop published |
| Creator commission | Per shop (FastMoss) | Per shop (FastMoss) | FastMoss tracking |
| Fulfillment | 8% | 10% | TikTok Shop / FBT pricing |
| Returns | 5% | 10% | Industry benchmark |
| Ad spend | 8% | 15% | Industry benchmark |
| COGS (product cost) | 20% | 40% | Category benchmark |
Net Margin Range = 1 − Platform − Commission − Fulfillment − Returns − Ad Spend − COGS
The low end represents an established seller with optimized creator network, low return rate, and favorable product economics. The high end represents a seller still scaling with higher acquisition costs and broader COGS. Most real sellers sit somewhere in between — and the Top 10 below show why range matters more than precision.
The Top 10 US TikTok Shops — Q1 2026 Profitability Breakdown
#1 — medicube US Store

Category: Beauty & Personal Care | Company: APR US INC | Shop Rating: 4.2
| Q1 Revenue | Q1 Units Sold | AOV | Active Products | Affiliated Creators |
|---|---|---|---|---|
| $65.9M | 1,182,000 | $56 | 128 | 85,300 |
Estimated Net Margin Range: 5%–39%
medicube US Store is the largest US TikTok Shop seller in Q1 2026 by revenue — and the textbook case for K-beauty’s dominance on the platform. The shop generated $65.9M across 1.18M units sold, with monthly performance accelerating throughout the quarter (Jan $17.6M → Feb $18.9M → Mar $29.4M). At an AOV of $56, medicube sits in a category sweet spot: high enough that FBT fees don’t crush margin, low enough to convert from short-form video without heavy ad support.
The 85,300 affiliated creators represent the largest creator network in the Top 10 — a moat that took years of brand building and Korean skincare credibility to construct. Generating $773 of revenue per affiliated creator, medicube has scaled creator partnerships at industry-leading volume, though revenue-per-creator efficiency lags shops with smaller, more curated networks (see FRODIO and Shark Home below). → View on FastMoss
#2 — Dr.Melaxin

Category: Beauty & Personal Care | Company: BRAND501 US Corp. | Shop Rating: 4.6
| Q1 Revenue | Q1 Units Sold | AOV | Active Products | Affiliated Creators |
|---|---|---|---|---|
| $52.3M | 1,453,300 | $36 | 108 | 37,200 |
Estimated Net Margin Range: 5%–39%
Dr.Melaxin is the second K-beauty brand in the Top 10 — and notably, sells more units (1.45M vs medicube’s 1.18M) at a lower AOV ($36 vs $56). The shop’s 4.6 rating is the joint-highest in the Top 10, alongside Tarte Cosmetics, and the 37,200 creator network is less than half medicube’s — yet Dr.Melaxin still generated $1,406 of revenue per affiliated creator, meaningfully higher than medicube’s efficiency.
Dr.Melaxin’s Q1 trajectory was the most consistent in the Top 10 (Jan $17.3M → Feb $16.2M → Mar $18.8M). Combined with medicube, the two K-beauty brands generated $118.2M in Q1 — alone outperforming the entire bottom half of the Top 10 combined. → View on FastMoss
#3 — QVC, Inc

Category: Shoes | Company: QVC, Inc | Shop Rating: 4.1
| Q1 Revenue | Q1 Units Sold | AOV | Active Products | Affiliated Creators |
|---|---|---|---|---|
| $39.5M | 664,400 | $59 | 4,800 | 42,800 |
Estimated Net Margin Range: 10%–44%
QVC, Inc represents one of the most distinctive cases in the Top 10 — a legacy live shopping brand (40 years old, originally on cable TV) successfully replatforming onto TikTok Shop. The shop’s product catalog of 4,800 active SKUs is by far the largest in the Top 10 (second is VEVOR at 3,300), reflecting QVC’s catalog-driven heritage rather than the DTC narrow-SKU approach of brands like medicube. Q1 trajectory was strong (Jan $9.0M → Feb $15.2M → Mar $15.3M), with February’s 68% revenue jump signaling the platform’s increasing acceptance of multi-category retail.
With a $59 AOV across primarily live-stream-driven sales, QVC has access to a margin structure that pure DTC sellers don’t — established supplier relationships, brand-name product mix, and decades of operational scale in live commerce. → View on FastMoss
#4 — Tarte Cosmetics
Category: Beauty & Personal Care | Company: Tarte Cosmetics | Shop Rating: 4.6
| Q1 Revenue | Q1 Units Sold | AOV | Active Products | Affiliated Creators |
|---|---|---|---|---|
| $36.7M | 1,171,900 | $31 | 161 | 70,000 |
Estimated Net Margin Range: 8%–42%
Tarte Cosmetics is the highest-ranked US-native beauty brand in the Top 10 — and the most cautionary AOV story. At a $31 AOV, Tarte sits at the edge of the “FBT margin trap” where fulfillment costs consume 11%+ of every sale. The 4.6 shop rating (tied with Dr.Melaxin) suggests strong product quality, which mitigates return-rate risk, but the low AOV puts a structural ceiling on per-unit profit.
Tarte’s 70,000 creator network is the second-largest in the Top 10. The brand’s established US presence pre-TikTok provides organic creator interest that newer brands have to pay for via higher commissions, creating a defensive moat that justifies the lower-AOV positioning. → View on FastMoss
#5 — VEVOR Store
Category: Tools & Hardware | Company: VEVOR STORE INC | Shop Rating: 4.1
| Q1 Revenue | Q1 Units Sold | AOV | Active Products | Affiliated Creators |
|---|---|---|---|---|
| $31.6M | 395,800 | $80 | 3,300 | 33,000 |
Estimated Net Margin Range: 12%–46%
VEVOR Store is the only Tools & Hardware shop in the Top 10 — and the second-best Q1 growth story (Jan $6.1M → Feb $9.9M → Mar $15.6M, a 156% increase). The $80 AOV puts VEVOR firmly above the FBT margin trap line, and Tools & Hardware historically carry lower return rates than apparel or beauty. With 3,300 active products, VEVOR runs a wide-catalog model similar to QVC’s, though the category mix is industrial/utility rather than retail consumer.
The lower estimated commission rate (around 8%) reflects Tools & Hardware as a category that doesn’t require aggressive affiliate recruitment — buyers searching for industrial tools convert without heavy creator-driven content. → View on FastMoss
#6 — Halara US

Category: Sports & Outdoor | Company: HK DFS LIMITED | Shop Rating: 4.2
| Q1 Revenue | Q1 Units Sold | AOV | Active Products | Affiliated Creators |
|---|---|---|---|---|
| $28.5M | 798,700 | $36 | 348 | 48,800 |
Estimated Net Margin Range: 10%–44%
Halara US is the top Sports & Outdoor seller in Q1 2026 — operating the activewear apparel playbook that has worked for similar brands in European TikTok Shop markets (Easy Yoga in Spain, France, and Italy). The $36 AOV is on the lower end and exposes Halara to FBT margin pressure on individual units, though apparel return rates can run high in the 10–15% range, which is the larger structural risk.
With 348 active products and 48,800 affiliated creators, Halara has built a moderately broad catalog supported by creator-driven try-on content. The brand’s challenge in 2026 will be defending margin as competition in athleisure intensifies. → View on FastMoss
#7 — Shark Home

Category: Household Appliances | Company: SharkNinja Sales Company | Shop Rating: 3.8
| Q1 Revenue | Q1 Units Sold | AOV | Active Products | Affiliated Creators |
|---|---|---|---|---|
| $26.8M | 97,000 | $276 | 47 | 14,500 |
Estimated Net Margin Range: 15%–49%
Shark Home has the highest AOV in the Top 10 — $276 — and the highest theoretical margin ceiling at 49%. The shop’s economics flip every assumption about TikTok Shop: only 97,000 units sold (10x less than medicube), only 47 active products, only 14,500 affiliated creators, yet $26.8M in Q1 revenue. Per-creator revenue is $1,848 — 2.4x medicube’s efficiency.
Shark Home’s Q1 trajectory was also the most aggressive (Jan $5.4M → Feb $4.9M → Mar $16.5M — a March explosion likely tied to a single new product launch or campaign). The 3.8 shop rating is the lowest in the Top 10 and is the key risk variable — at below 4, return shipping costs jump to 50% of fees, meaningfully compressing margin. → View on FastMoss
#8 — Comfrt
Category: Womenswear & Underwear | Company: Comfrt LLC | Shop Rating: 4.7
| Q1 Revenue | Q1 Units Sold | AOV | Active Products | Affiliated Creators |
|---|---|---|---|---|
| $26.2M | 629,900 | $42 | 112 | 37,300 |
Estimated Net Margin Range: 10%–44%
Comfrt has the highest shop rating in the Top 10 at 4.7 — meaning return shipping costs sit at the lower 20% tier and customer satisfaction protects the brand from review-driven conversion decay. The $42 AOV is comfortably above the FBT margin trap line, and the loungewear/comfortwear positioning carries lower return rates than fashion apparel.
Comfrt is the only Top 10 shop with a declining Q1 trajectory (Jan $10.7M → Feb $9.1M → Mar $6.4M). This pattern — strong start, fading momentum — often signals creator network fatigue: early creators have run their content cycle and the brand needs new creator acquisition to refresh GMV. → View on FastMoss
#9 — Micro Ingredients

Category: Health | Company: DPL Trading Inc | Shop Rating: 4.8
| Q1 Revenue | Q1 Units Sold | AOV | Active Products | Affiliated Creators |
|---|---|---|---|---|
| $26.1M | 811,700 | $32 | 270 | 67,000 |
Estimated Net Margin Range: 0%–34%
Micro Ingredients is the highest-rated shop in the Top 10 at 4.8 — and the most exposed to the margin compression that follows aggressive commission rates. Health and supplement brands typically pay 20–30% creator commissions to drive volume, and FastMoss data confirms this category clusters in the high end of the commission spectrum. The result: with a $32 AOV and elevated commission, Micro Ingredients shows the widest plausible margin range in the Top 10 (0%–34%), depending on whether the brand can offset commission with strong repeat purchases.
The Health/Supplement category structurally favors repeat purchase rates that other categories don’t enjoy — once a customer commits to a supplement brand, they reorder regularly. This is the unspoken advantage that justifies aggressive Q1 creator commissions. → View on FastMoss
#10 — FRODIO

Category: Fashion Accessories | Company: CEH TRADING CO., LTD | Shop Rating: 4.2
| Q1 Revenue | Q1 Units Sold | AOV | Active Products | Affiliated Creators |
|---|---|---|---|---|
| $21.9M | 238,300 | $92 | 56 | 2,900 |
Estimated Net Margin Range: 8%–42%
FRODIO is the most counterintuitive shop in the Top 10. With only 2,900 affiliated creators — 30x fewer than medicube — FRODIO still cleared $21.9M in Q1 revenue, translating to $7,552 of revenue per affiliated creator — by far the highest creator efficiency in the Top 10 (4x Shark Home’s, 10x medicube’s). At a $92 AOV, FRODIO operates in the upper-middle price tier where margin economics are favorable.
FRODIO’s model — narrow catalog (56 products), small creator network, high AOV — is the opposite of the K-beauty playbook. It suggests Fashion Accessories converts on visual fit-check content from a small number of high-performing creators rather than the broad creator volume approach. For sellers evaluating TikTok Shop entry strategy, FRODIO is the case study for “narrow and deep” — proving that not every seller needs 50,000+ affiliated creators to make the Top 10. → View on FastMoss
3 Patterns That Separate Profitable Sellers from GMV Mirages
Looking across the Top 10, three patterns separate sustainable profitability from “GMV growth at any cost.” For sellers benchmarking against the Top 10, these are the structural variables that matter:
Pattern 1: AOV above $50 is the profitability watershed
The Top 10 splits cleanly at the $50 AOV line. Shops above $50 — Shark Home ($276), FRODIO ($92), VEVOR ($80), QVC ($59), medicube ($56) — operate with structurally healthier margins because fulfillment costs become a smaller percentage of each transaction. Shops below $50 — Tarte ($31), Micro Ingredients ($32), Dr.Melaxin ($36), Halara ($36), Comfrt ($42) — depend on extraordinary volume to compensate for FBT pressure. Both models work at the Top 10 level, but the AOV-above-$50 cohort has more margin protection if growth slows.
Pattern 2: Creator efficiency is more predictive than creator count
Conventional TikTok Shop wisdom argues “the more creators, the better.” The Top 10 data complicates that. FRODIO’s $7,552 revenue per creator and Shark Home’s $1,848 demonstrate that small, highly-selected creator networks can outperform broad affiliate recruitment on a per-creator basis. For sellers building creator strategy in 2026, the right question isn’t “how many creators do I have?” — it’s “how much revenue does each creator drive?”
Pattern 3: Shop Rating directly compounds margin
Shop Rating isn’t just a vanity metric — it’s a margin lever. Below 4.0, return shipping costs jump from 20% to 50% of return fees, eroding 2–4 percentage points of net margin depending on return rate. In the Top 10, Shark Home (3.8) is the only shop below the 4.0 line and pays this margin penalty despite an otherwise favorable economic structure. Comfrt (4.7) and Micro Ingredients (4.8) — the highest-rated shops — preserve full margin upside on every sale.
Which Categories Are Genuinely Profitable on TikTok Shop?
The Top 10 distribution by category provides a category-level reading on which TikTok Shop categories have the strongest profitability foundations in 2026:
| Category | Top 10 Representation | Combined Q1 Revenue | Profitability Profile |
|---|---|---|---|
| Beauty & Personal Care | 3 of 10 (medicube, Dr.Melaxin, Tarte) | $154.9M | Strong — moderate AOV, strong creator network, replenishable |
| Shoes | 1 of 10 (QVC) | $39.5M | Strong — established brands, mid-AOV, low return-cost categories |
| Tools & Hardware | 1 of 10 (VEVOR) | $31.6M | Strong — high AOV, low commission needs, low return rates |
| Sports & Outdoor | 1 of 10 (Halara) | $28.5M | Moderate — low AOV, higher return rates |
| Household Appliances | 1 of 10 (Shark Home) | $26.8M | Strong — highest AOV, lowest commission needs, low volume risk |
| Womenswear & Underwear | 1 of 10 (Comfrt) | $26.2M | Moderate — depends on niche positioning and Shop Rating |
| Health | 1 of 10 (Micro Ingredients) | $26.1M | Variable — high commission compressed by strong repeat purchase |
| Fashion Accessories | 1 of 10 (FRODIO) | $21.9M | Strong — high AOV, high creator efficiency |
Beauty & Personal Care dominates the Top 10 in pure revenue volume, but the most structurally favorable categories for new entrants in 2026 are Tools & Hardware, Household Appliances, and Fashion Accessories — all categories with above-$50 AOV, lower commission requirements, and less category saturation than Beauty.
How to Estimate Your Own TikTok Shop Profitability
Before investing in TikTok Shop, sellers should model their own margin scenario using the same formula applied here. The five inputs that matter:
- Expected AOV: Is your product above or below the $50 threshold?
- Commission strategy: Are you targeting 5–10% (established brand model) or 20–30% (newer brand growth model)?
- Category return rate: Apparel and beauty average 10–15%; tools and appliances average 5–8%
- Ad spend allocation: Are you funding GMV Max at 10% or 20% of GMV?
- COGS: What percentage of revenue goes to product cost (typically 20–40% depending on category)?
Plugging these into the disclosed formula gives a personalized low-to-high margin range. Most sellers will discover their realistic margin sits between 10% and 25%, well below the headline GMV growth numbers that drive most TikTok Shop reporting.
How FastMoss Helps You Track Real Profitability Signals
Headline GMV numbers don’t tell sellers whether a product, category, or competitor is actually building sustainable margin. FastMoss tracks the underlying signals that profitability depends on — commission rates by product, creator network efficiency, shop ratings across markets, AOV trends, and product velocity acceleration.
For sellers evaluating TikTok Shop entry, expansion, or competitive positioning, this real-time data is the foundation of a margin-aware strategy. New users can use code NEW000 for up to 50% off paid plans.
Frequently Asked Questions
Is TikTok Shop profitable for sellers?
TikTok Shop is profitable for sellers who manage five variables effectively: AOV above $50, commission rates aligned with brand stage, return rates below 10%, ad spend below 15% of GMV, and COGS below 40%. Based on FastMoss Q1 2026 data, the Top 10 US sellers achieve estimated net margins ranging from 5% (compressed) to 49% (optimal). The industry-wide average sits at around 18.4%, with more than 50% of all TikTok Shops inactive.
What’s the average TikTok Shop profit margin in 2026?
According to 2026 industry tracking, the average active US TikTok Shop seller nets approximately $690 per month on $3,750 in sales — an 18.4% net margin after platform fees, creator commissions, fulfillment, returns, and ad spend. Top performers can clear 30–45% net margins, while struggling sellers operate at or below break-even.
How much do TikTok Shop sellers actually make?
The distribution is highly skewed. The Top 10 US sellers in Q1 2026 generated a combined $355.5M in revenue (FastMoss data). At the same time, fewer than 10% of new TikTok Shop sellers survive their first year. Active median sellers earn $690/month in net profit; the top decile clears tens of thousands per month.
What are TikTok Shop’s fees and commission rates?
TikTok Shop charges a base platform referral fee of 5–8% plus payment processing of 1–2%. Sellers also pay affiliate creator commissions of 5–30% (averaging 10–15% for established brands and 20–30% for newer brands recruiting creators aggressively). Fulfillment via Fulfilled by TikTok (FBT) runs $2.86–$3.58 per unit.
Which TikTok Shop category is most profitable?
Based on Top 10 US Q1 2026 data, the most structurally profitable categories combine above-$50 AOV with lower commission requirements: Household Appliances (Shark Home — $276 AOV), Fashion Accessories (FRODIO — $92 AOV), Tools & Hardware (VEVOR — $80 AOV), and Shoes (QVC — $59 AOV). Beauty & Personal Care dominates by total revenue but operates with tighter margins due to lower AOV and higher commission rates.
Why are most TikTok Shop sellers losing money?
Most TikTok Shop sellers operate below break-even because of one or more structural issues: AOV below $25 (where FBT consumes 11%+ of every sale), commission rates above 25% (compressing margin), Shop Rating below 4.0 (triggering 50% return shipping cost), or COGS above 50% (leaving insufficient gross margin for platform costs).
Is TikTok Shop better than Amazon for new sellers?
The comparison depends on category and brand stage. TikTok Shop converts at 5–8% in-app vs Amazon’s typical 10–15% — but TikTok offers discovery to new audiences that Amazon doesn’t. For low-AOV impulse products, TikTok Shop’s content-driven model works strongly. For high-consideration purchases above $100, Amazon’s search-driven model often outperforms.
Does FastMoss have a discount code?
Yes. The current FastMoss promo code is NEW000. Enter it at checkout on fastmoss.com to unlock your discount as a new user. FastMoss is the leading TikTok Shop analytics platform tracking real-time GMV, category rankings, creator performance, and shop-level signals — the data source behind this analysis.
🎯 Find Your Next Breakout Product
FastMoss tracks every TikTok Shop product in real-time — see today’s velocity leaders before they hit your competitors’ radar.