Search Google for the “best time to post on TikTok,” and you will be bombarded with thousands of articles claiming to have cracked the code. They will tell you that Tuesday at 9:00 AM or Thursday at 7:00 PM are the undisputed golden hours.
But here is the reality: these “universal” infographics are fundamentally flawed. The TikTok algorithm is highly localized and deeply personalized. A posting schedule that works perfectly for a tech reviewer in New York will completely miss the mark for a fashion creator targeting audiences in London. The real “best time” isn’t a widely shared industry secret; it is hidden entirely within your own analytics dashboard in FastMoss.
To maximize your impact, you have to transition from a mindset of guesswork to a strictly data-driven approach, optimizing your content distribution for actual conversion funnels rather than generic advice.
The Illusion of Effort: Creator Activity vs. Audience Engagement
One of the most common mistakes creators and brands make is suffering from the “Timing Mismatch.” This happens when you publish content when it is most convenient for you to post, rather than when your audience is actually primed to interact.
Let’s look at a concrete case study from a creator dashboard to see what this looks like in FastMoss.
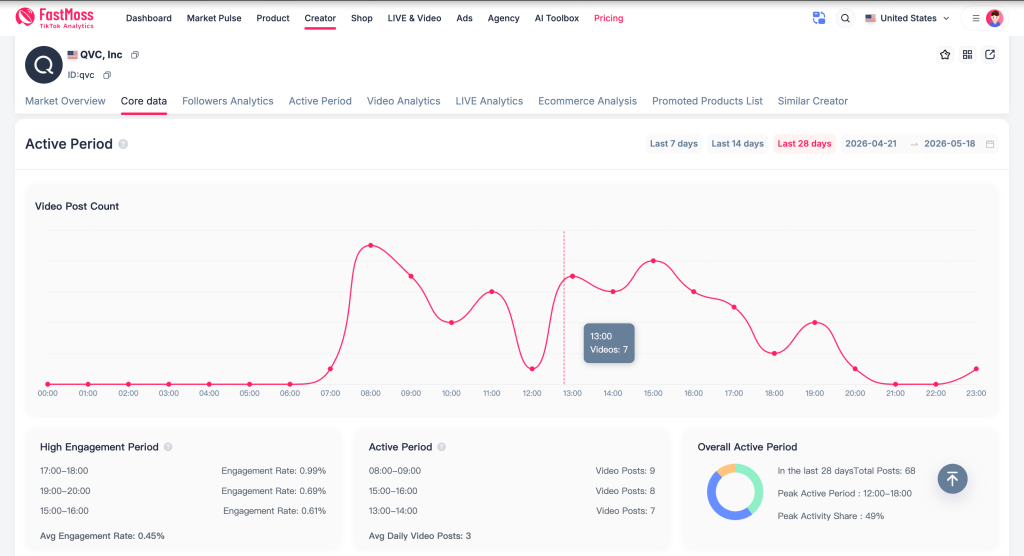
If you look closely at the Active Period chart, this creator is putting in the heavy lifting early in the day. Their highest volume of output happens between 08:00 and 09:00 AM (9 video posts).
However, drop your eyes to the bottom left High Engagement Period module. The audience’s actual peak interaction time—when they are actively liking, commenting, and staying on the video—is between 17:00 and 18:00 (5:00 PM – 6:00 PM), hitting a stellar engagement rate of 0.99%.
This is the cost of bad timing. The account’s baseline average engagement rate is 0.45%. By pushing out their highest volume of content at 8:00 AM, they are practically shouting into an empty room. If they simply shifted their daily publishing schedule by 9 hours, moving those core posts to 5:00 PM, they could theoretically double their engagement rate without changing a single thing about the video itself.
Posting when you are most active is not the same as posting when your audience is most receptive. Don’t settle for a 0.45% baseline when a simple schedule shift could double it.
Down the Funnel: Tying Timing to Revenue
Going viral and getting high engagement is a great top-of-funnel metric. But for e-commerce brands and professional creators, views don’t keep the lights on—revenue does. High engagement does not automatically equate to high sales.
When optimizing your schedule, you need to look further down the conversion funnel and correlate your publish times with hard commercial metrics.
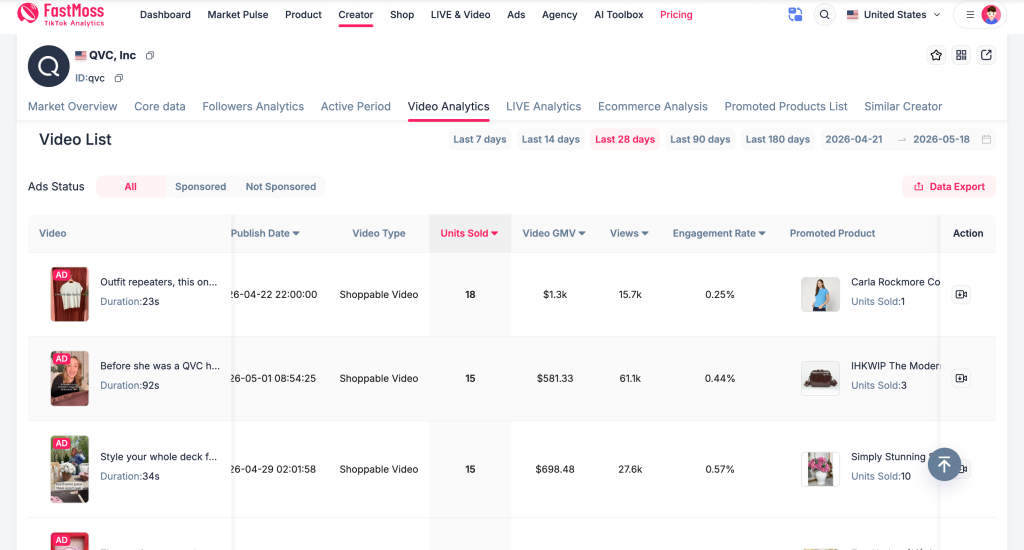
Notice how different publish times yield different commercial results. A video posted late at night (22:00:00) might perform differently than one posted in the morning (08:54:25). If your primary objective is to push a Shoppable Video, your “best time to post” is the exact window that historically yields the highest GMV, even if a different time slot gets slightly more raw views.
The optimal time to post a top-of-funnel brand awareness video often differs entirely from the best time to drop a high-conversion, bottom-of-funnel product pitch.
The Actionable Playbook: Finding Your Golden Window
Stop relying on generic advice and start building your own data model. Here is exactly how to find your optimal posting schedule:
Define Your Goal: Are you optimizing for top-of-funnel Reach (Views), mid-funnel Community (Engagement Rate), or bottom-of-funnel Revenue (GMV)? Your target metric dictates your timing strategy.
Audit Your Dashboards: Cross-reference your “Active Period” with your “High Engagement Period” using a professional analytics tool. Identify any massive gaps between when you hit “publish” and when your audience actually responds.
Run Micro A/B Tests: Don’t overhaul your entire content calendar overnight. Take your highest-performing video format and schedule it 1 to 2 hours closer to your peak engagement window.
Monitor the Ripple Effect: Track this new schedule for 7 to 14 days. Watch how this micro-adjustment impacts your baseline engagement and, more importantly, your e-commerce conversion rates.
There is no magic hour on TikTok, only your audience’s unique behavioral patterns. It is time to let the data dictate the strategy. Open FastMoss, find your true High Engagement Period, and schedule your next post accordingly.