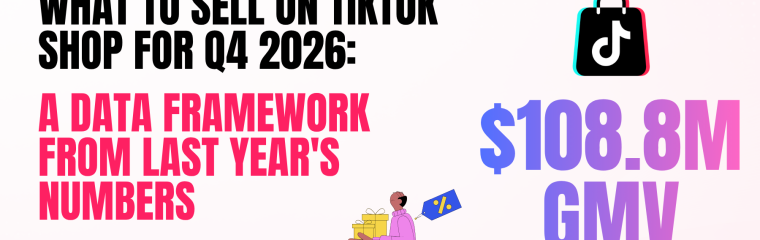
Quick Answer: Toys & Hobbies showed the strongest Q4 lift on TikTok Shop US last year, December volume running 4.36× January. Yet none of the quarter’s top 10 best sellers came from that category. The Top 10 combined $108.8M in Q4 GMV, led by a $93 skincare set at $24.7M. Last updated: August 2026 · Data sourced from FastMoss
Why Q4 Buying Decisions Get Made in August
Black Friday 2026 falls on November 27. That is 105 days from now, which feels like plenty of time until you work backward through a container.
Sea freight from Asia to a US warehouse runs 30 to 45 days door to door before customs and inbound processing. Add the buffer that most sellers learn to add after their first missed peak, and the practical order deadline for Black Friday inventory lands somewhere between September 28 and October 13. Air freight buys you a few weeks and costs you most of the margin you were protecting.
So the decision window is now. The question is which categories deserve the cash.
The stakes have grown. TikTok Shop US generated $15.82 billion in 2025 GMV, up 108% year over year, and now accounts for 18.2% of all US social commerce, according to EMARKETER. The same forecast puts 2026 above $20 billion. Retail Dive reported that TikTok Shop is the single largest driver of that growth.
About This Data
All data sourced from FastMoss — TikTok Shop’s leading third-party analytics platform — for the US market.
- Category window: January 2025 through December 2025, monthly, plus January / March / May / July 2026 for current-year trend
- Product window: October, November and December 2025
- Market: United States. All figures in USD
- Sample: Top 20 categories per month by units sold (29 level-1 categories exist); top 20 products per month by GMV (500 rank per month)
- Sort basis: categories by
category_units_solddescending; products byperiod_gmvdescending - Q4 premium formula: mean monthly units sold across October–December, divided by mean monthly units sold across January–September. Calculated from FastMoss monthly data
- Relative premium: a category’s Q4 premium divided by the all-category Q4 premium of 1.64, so a reading above 1.0 means the category outpaced the market during peak
- Product Q4 totals: summed from the monthly GMV figures for the months in which a product appeared in that month’s Top 20. Months outside the Top 20 count as zero, so these are in-chart totals rather than full-quarter sales
- Units basis: the category ranking endpoint reports units sold rather than category GMV, so seasonality here is measured on volume. Volume is arguably the cleaner read anyway, since it is not distorted by price-mix shifts
- Categories included: 17 of 29, being those with complete data in all 12 months of 2025. Missing months were left out rather than counted as zero, which would have inflated the premium
Every one of the Top 10 was checked individually against its product record for rating, review count, stock level and creator linkage. All data is sourced directly from FastMoss. Click any product link to view its live performance dashboard, or start a free FastMoss trial with code NEW000 for up to 50% off real-time analytics.
Three listings we removed, and why
Raw GMV rankings carry artifacts. Three of the 40 products captured were not consumer products at all, and together they would have added $6.73M of phantom demand to the analysis:
| Listing | Q4 GMV | Why it was removed |
|---|---|---|
| “1 Supply 1728529437769 Platform Product Test Product…” | $1,538,298 | The title says “Platform Product Test Product.” Shop name is a placeholder string. Reported growth rate of 13,733,900%. Delisted. |
| “Dear customers, when you purchase women’s clothing items…priority packaging and delivery services.” | $2,668,747 | A shipping upgrade, not a physical product. Used to move volume. Delisted. |
| “Vinyl Auction” | $2,522,516 | Listed at $1.00, yet 1,025 units settled at $2,461 each. This is a live-auction settlement vehicle. Commission set to 0%. Delisted. |
If you pull these rankings yourself, expect to find similar entries every quarter, and expect more of them in November than in any other month.
The Q4 Premium: Which Categories Actually Spike
Across the 17 categories with complete 2025 data, the whole market ran a Q4 premium of 1.64. Peak-quarter volume was 64% above the rest of the year. That number matters because it changes what “seasonal” means: a category growing 50% in Q4 is not seasonal, it is lagging.
| Category | Q4 premium | vs market | Peak month | Dec vs Jan | 2026 YoY (Jul) |
|---|---|---|---|---|---|
| Toys & Hobbies | 3.00 | 1.83 | December | 4.36× | +7.87% |
| Home Supplies | 2.14 | 1.31 | December | 3.17× | +12.30% |
| Menswear & Underwear | 2.02 | 1.24 | December | 2.45× | +11.18% |
| Computers & Office | 1.92 | 1.17 | December | 1.97× | +38.55% |
| Kitchenware | 1.88 | 1.15 | December | 2.12× | +6.95% |
| Shoes | 1.87 | 1.14 | December | 2.30× | +15.57% |
| Fashion Accessories | 1.68 | 1.02 | December | 1.96× | +17.28% |
| Beauty & Personal Care | 1.62 | 0.99 | November | 1.90× | +0.82% |
| Womenswear & Underwear | 1.56 | 0.95 | November | 1.67× | −7.53% |
| Home Improvement | 1.53 | 0.93 | November | 1.44× | +20.66% |
| Automotive & Motorcycle | 1.52 | 0.93 | December | 1.82× | −4.26% |
| Luggage & Bags | 1.50 | 0.92 | December | 1.39× | +15.18% |
| Phones & Electronics | 1.50 | 0.92 | December | 1.70× | +2.01% |
| Sports & Outdoor | 1.38 | 0.84 | December | 1.60× | −5.86% |
| Collectibles | 1.35 | 0.83 | December | 1.20× | +14.91% |
| Food & Beverages | 1.29 | 0.79 | December | 1.26× | +10.55% |
| Health | 1.28 | 0.78 | November | 1.56× | −8.22% |
Toys & Hobbies is the standout. Its December volume was 4.36 times its January volume, and its peak-quarter average ran 83% ahead of the market’s own seasonal lift. Nothing else comes close.
At the other end, Health posted a premium of 1.28. In absolute terms that is growth. Measured against a market that lifted 1.64, a Health seller who simply held share lost ground during the only quarter that pays for the year.
November or December is a real fork
Thirteen of the 17 categories peaked in December. Four peaked in November: Beauty & Personal Care, Womenswear & Underwear, Home Improvement and Health.
That split has an operational consequence. A November-peaking category needs inventory landed and creator campaigns live before Black Friday week. A December-peaking category gives you two extra weeks, which in freight terms is the difference between a comfortable booking and an air-freight decision.
Four Quadrants: Where to Load Up, Where to Hold Back
Seasonality alone is a trap. A category can spike reliably every Q4 while its underlying demand erodes year over year, and last year’s premium will still look attractive right up until the inventory arrives.
Crossing relative Q4 premium against 2026 year-over-year GMV growth through July, the 17 categories sort into four groups.
| Quadrant | Reading | Categories |
|---|---|---|
| A · Load up | Beats the market in Q4, still growing in 2026 | Toys & Hobbies, Home Supplies, Menswear & Underwear, Computers & Office, Kitchenware, Shoes, Fashion Accessories |
| B · Seasonal but shrinking | Beats the market in Q4, declining in 2026 | None |
| C · Year-round, no Q4 bump | Trails the market in Q4, growing in 2026 | Beauty & Personal Care, Home Improvement, Luggage & Bags, Phones & Electronics, Collectibles, Food & Beverages |
| D · Avoid for Q4 | Trails the market in Q4, declining in 2026 | Womenswear & Underwear, Automotive & Motorcycle, Sports & Outdoor, Health |
Quadrant B being empty is itself informative. Every category that outperformed during last year’s peak is still growing this year, which suggests seasonal strength on this platform tracks real demand rather than discount-driven churn.
Quadrant C deserves a second look before you write it off. Beauty & Personal Care is the largest category on TikTok Shop US by volume and it still nearly doubled from January to December. It just did not beat the market average. For a Beauty seller the read is not “skip Q4,” it is “Q4 will not fix a weak year.”
The Top 10 Best-Selling Products on TikTok Shop US in Q4 2025
These are the ten highest-GMV products across October, November and December 2025, after the three excluded listings were removed. The “months on chart” column counts how many of the three months each product held a Top 20 position, which separates a genuine quarter-long run from a single viral week.
1. medicube Affordable Glass Glow Skincare Set
Shop: medicube US Store | Price: $93.00–94.00 | Category: Beauty & Personal Care | Commission: 15%
| Q4 GMV | $24,684,407 | Units | 130,032 |
| Months on chart | 3/3 | Lifetime GMV | $71,571,187 |
| Q4 share of lifetime | 34.5% | Rating | 4.7 (38,514 reviews) |
| Linked creators | 31,780 | Listed | Aug 2024 |
An eight-product Korean skincare bundle that took the top spot with more GMV than the next two combined. Its November figure of $14.08M ran 69% above its December figure of $8.30M, which is the Beauty pattern showing up at the product level. With 31,780 creators linked and 24,147 live sessions, this is a saturation play rather than a discovery play. The 950k+ stock position tells you medicube committed to peak months in advance.
2. Toplux Magnesium Complex 8 Essential Magnesium Supplement
Shop: Toplux Nutrition | Price: $15.00 | Category: Health | Commission: 25%
| Q4 GMV | $15,527,468 | Units | 405,914 |
| Months on chart | 3/3 | Lifetime GMV | $48,794,733 |
| Q4 share of lifetime | 31.8% | Rating | 4.6 (153,311 reviews) |
| Linked creators | 17,040 | Listed | Mar 2024 |
A $15 supplement moving 405,914 units in a quarter, at a 25% commission that makes the affiliate math work without a discount. It ranks first in its category and second across the entire US market by sales rank. Health sits in Quadrant D, which makes this product a useful correction to the category read: a weak category still produces winners, it just produces fewer of them.
3. PetPivot AutoScooper Self-Cleaning Cat Litter Box
Shop: PetPivot | Price: $139.40–148.90 | Category: Pet Supplies | Commission: 7%
| Q4 GMV | $13,187,838 | Units | 74,204 |
| Months on chart | 3/3 | Lifetime GMV | $26,106,202 |
| Q4 share of lifetime | 50.5% | Rating | 4.6 (15,110 reviews) |
| Linked creators | 3,333 | Listed | Aug 2024 |
Half of everything this product has ever sold happened in one quarter. At $139 and a 7% commission it pays creators less per sale than most of this list, and it still held a Top 20 position all three months with only 3,333 linked creators. A durable-goods purchase people defer until there is a reason to buy, and Q4 supplies the reason.
4. The Original Magic Fleece Lined Leggings
Shop: SWEET MAYHEM | Price: $15.99–27.99 | Category: Womenswear & Underwear | Commission: 12%
| Q4 GMV | $9,004,055 | Units | 317,815 |
| Months on chart | 3/3 | Lifetime GMV | $16,047,953 |
| Q4 share of lifetime | 56.1% | Rating | 4.2 (37,459 reviews) |
| Linked creators | 10,202 | Listed | Oct 2023 |
A weather product, and the clearest seasonal case on the list: 56.1% of lifetime GMV in a single quarter, three years after launch. This one product accounts for 99.4% of its shop’s entire GMV. The 4.2 rating is the lowest in the Top 10 and it did not stop the product from selling 317,815 units, which says something about how much rating matters when the category is cheap apparel.
5. Rhino USA Retractable Ratchet Straps
Shop: Rhino USA | Price: $33.20–65.90 | Category: Automotive & Motorcycle | Commission: 15%
| Q4 GMV | $8,988,396 | Units | 116,482 |
| Months on chart | 2/3 | Lifetime GMV | $20,118,554 |
| Q4 share of lifetime | 44.7% | Rating | 4.7 (19,657 reviews) |
| Linked creators | 8,264 | Listed | Oct 2023 |
Tie-down straps for trucks and trailers, which is not a gift and not seasonal in any obvious way, yet 44.7% of lifetime GMV landed in Q4. Its November GMV of $5.26M came with a reported 598% units growth rate. The likely explanation is that Q4 on TikTok Shop is a discount event before it is a gifting event, and practical goods respond to discounts too.
6. NuDerma Clinical High Frequency Wand
Shop: Pure Daily Care | Price: $85.49 | Category: Beauty & Personal Care | Commission: 15%
| Q4 GMV | $8,851,813 | Units | 17,934 |
| Months on chart | 2/3 | Lifetime GMV | $15,382,667 |
| Q4 share of lifetime | 57.5% | Rating | 4.6 (3,413 reviews) |
| Linked creators | 4,166 | Listed | Oct 2023 |
The highest seasonal concentration in the Top 10 at 57.5% of lifetime GMV. An $85 beauty device is a classic self-gift, and it appeared on the chart only in November and December. Worth noting for anyone modeling this one: its stock count at time of writing sits under 400 units, so the current listing is not positioned for another peak at that scale.
7. HQYEX & VOLTVOGUE Electric Bike
Shop: AOVOPRO STORE | Price: $600.00 | Category: Sports & Outdoor | Commission: 5%
| Q4 GMV | $7,545,152 | Units | 11,541 |
| Months on chart | 3/3 | Lifetime GMV | $18,705,251 |
| Q4 share of lifetime | 40.3% | Rating | 4.7 (5,984 reviews) |
| Linked creators | 513 | Listed | Jun 2025 |
A $600 item holding a Top 20 spot for three straight months on 513 linked creators and zero live sessions. That creator count is the lowest in the Top 10 by a wide margin, 1.6% of medicube’s. High-ticket categories concentrate demand into a small number of creators who can carry a considered purchase, which inverts the usual TikTok Shop assumption that reach wins. Listed in June 2025, so its lifetime figure covers a shorter window than most of this list.
8. Goli Zero Sugar Best Seller Trio
Shop: Goli Nutrition | Price: $32.00 | Category: Health | Commission: 25%
| Q4 GMV | $7,377,245 | Units | 219,284 |
| Months on chart | 2/3 | Lifetime GMV | $33,076,287 |
| Q4 share of lifetime | 22.3% | Rating | 4.5 (47,159 reviews) |
| Linked creators | 13,681 | Listed | May 2025 |
The least seasonal product on the list at 22.3%, which is what a genuine year-round seller looks like. It carries 110,416 linked videos, the highest video count in the Top 10, against zero live sessions. Goli runs a pure video-affiliate model at scale, and Q4 is a rising tide rather than the whole business.
9. Nex Playground Active Play System
Shop: Nex Playground | Price: $299.00 | Category: Phones & Electronics | Commission: 20%
| Q4 GMV | $6,861,696 | Units | 27,384 |
| Months on chart | 1/3 | Lifetime GMV | $12,168,556 |
| Q4 share of lifetime | 56.4% | Rating | 4.7 (2,867 reviews) |
| Linked creators | 5,875 | Listed | Aug 2024 |
The only single-month entry in the Top 10, and it earned its place on November alone. A $299 kids’ game console is a Christmas purchase made on Black Friday, and the shape of the data matches that exactly. This product represents 99.5% of its shop’s lifetime GMV, making Nex Playground the purest one-product business on this list. A 20% commission on a $299 item is $60 per sale, which is what it takes to get creators to explain a new product category.
10. EcoFlow DELTA 3 Classic Portable Power Station
Shop: EcoFlow Technology Inc. | Price: $469.00–999.00 | Category: Home Improvement | Commission: 6%
| Q4 GMV | $6,816,151 | Units | 20,299 |
| Months on chart | 2/3 | Lifetime GMV | $22,618,014 |
| Q4 share of lifetime | 30.1% | Rating | 4.9 (10,527 reviews) |
| Linked creators | 2,586 | Listed | Sep 2025 |
The highest-rated product in the Top 10 at 4.9, on the lowest commission at 6%. EcoFlow also placed a second power station in November’s Top 20 at $3.30M, so the brand took two positions in one month. Listed in September 2025, which means it reached this volume in its first quarter on the platform.
Five Patterns Every TikTok Shop Seller Should Know About Q4
The categories that spike hardest produce the fewest hits
Seven categories beat the market’s seasonal lift last Q4. Between them they produced zero of the quarter’s top 10 products. Every Top 10 entry came from a category that either matched the market or trailed it. Toys & Hobbies tripled its off-season volume and put nobody on the leaderboard.
The reason is concentration. In Toys & Hobbies, the top 50 products account for 21.89% of category units, spread across many small winners. In Health, the top 50 account for 31.96%, and in Food & Beverages 38.38%. A seasonal spike in a fragmented category lifts hundreds of listings a little. A spike in a concentrated category lifts a handful of listings a lot. Which one you want depends on whether you are trying to place a bet or catch a wave.
Five out of six Q4 winners cannot hold the chart for a full quarter
Of the 37 legitimate products captured across the three months, only 6 held a Top 20 position in all three. Eight managed two months. Twenty-three appeared exactly once.
That is 83.8% of Q4 winners failing to sustain a single quarter. If your Q4 plan assumes a product that works in October still works in December, the base rate is against you. The six that held all three months were medicube’s Glass Glow set, Toplux Magnesium, the PetPivot litter box, the Magic Leggings, the HQYEX electric bike, and Dr.Melaxin’s Calcium Multi Balm at $6.69M. Their linked creator counts run from 513 to 31,780, so the size of a creator network does not explain durability either.
Peak month splits the calendar in two
Thirteen categories peaked in December, four in November. The November group is Beauty, Womenswear, Home Improvement and Health. Three of those four sit in Quadrant C or D. The categories worth loading up on mostly peak in December, which buys two extra weeks of freight tolerance for exactly the inventory you most want to get right.
Six of the Top 10 are effectively one-product companies
For six Top 10 entries, that single product represents more than half of its shop’s lifetime GMV. Nex Playground sits at 99.5%, SWEET MAYHEM at 99.4%, PetPivot at 73.9%, AOVOPRO at 68.8%, Toplux at 59.1%, Pure Daily Care at 58.8%.
TikTok Shop rewards depth over breadth in a way most marketplaces do not. The catalog strategy that works on Amazon, built on many SKUs and thin margins, is not what produced these numbers. One product with enough creator content behind it did.
Commission rate and GMV move in opposite directions
The two highest-GMV products in Health pay 25% commission. The two highest-ticket items on the list, the electric bike at $600 and EcoFlow at $469–999, pay 5% and 6%. PetPivot moved $13.2M at 7%.
Creators price by expected dollars per video, not by percentage. A 5% commission on $600 is $30, comfortably more than 25% of a $15 supplement. When you set Q4 commission, the number that matters to a creator is the absolute payout, and the percentage is only how you get there.
What This Means for Q4 2026 Buying Decisions
Four things follow from the data above, in the order you would act on them.
Match your category to your position, not to the biggest premium. If you already have creator relationships and content volume, Quadrant C categories reward that, since demand there is steady and your existing advantage carries. If you are placing a fresh bet with new inventory, Quadrant A gives you a rising tide. Buying into Toys & Hobbies without a creator network is buying into the most competitive fragmentation on the platform.
Book freight against your category’s peak month, not against Black Friday. A December-peaking category tolerates an October 13 order date. A November-peaking one wants that inventory landed by late October, which pulls your decision to the end of September.
Set commission by absolute payout. Work out what a creator earns per unit at your price, then compare that to what they earn promoting something else in your category. If your number is below $10 and your product needs explaining, the percentage will not save you.
Treat the four Quadrant D categories as a higher bar, not a closed door. Health is in Quadrant D and produced two Top 10 products. The read is that these categories will not carry you, so the product has to.
One caveat on reading year-over-year figures for last Q4. November 2025 posted unusually high year-over-year growth across most categories: Beauty at +92.55%, Toys at +126.79%, Phones & Electronics at +126.28%. December of the same year came in near flat or slightly negative. A gap that large between two consecutive months points to something in the 2024 comparison base rather than demand doubling and then stopping. For judging current direction, the 2026 figures in the table above are the more reliable guide.
How FastMoss Helps You Track Q4 Demand
The analysis on this page took three types of query, all of which you can run directly:
- Category seasonality: pull monthly category rankings for a full year, then compare peak-quarter volume against the rest of the year to get your own premium figures for the categories you actually sell in
- Product durability: check how many consecutive months a product holds a ranking position before you commit to a similar SKU, rather than reading a single month’s chart
- Creator economics: look at linked creator counts, video counts and live session counts per product to see whether a category is won through reach or through a small number of high-intent creators
FastMoss covers the US, UK and five EU markets, with historical data going back more than 1,200 days, which is what makes a year-over-year seasonal comparison possible in the first place.
Frequently Asked Questions
What should I sell on TikTok Shop for Q4 2026?
Based on FastMoss data from Q4 2025, the categories that both outperformed the market’s seasonal lift and are still growing in 2026 are Toys & Hobbies, Home Supplies, Menswear & Underwear, Computers & Office, Kitchenware, Shoes, and Fashion Accessories. Toys & Hobbies showed the strongest lift, with December volume at 4.36 times January. Note that these categories are fragmented, so they suit sellers who can move quickly on many small opportunities more than sellers placing one large bet.
When do I need to order inventory for Black Friday 2026?
Black Friday 2026 falls on November 27. Sea freight from Asia runs 30 to 45 days plus customs and inbound handling, which puts the practical order deadline between late September and mid-October. Categories that peak in November rather than December need that inventory two weeks earlier.
Which TikTok Shop categories are worth avoiding in Q4?
Four categories both underperformed the market during Q4 2025 and are down year over year in 2026: Womenswear & Underwear, Automotive & Motorcycle, Sports & Outdoor, and Health. That does not make them unsellable. Health produced two of the quarter’s top 10 products. It means the category will not do the work for you.
How much did the top TikTok Shop products make in Q4?
The ten highest-GMV products on TikTok Shop US combined for $108.8M across October to December 2025, summed from FastMoss monthly data. The leader, a medicube skincare set priced at $93 to $94, accounted for $24.7M of that on 130,032 units.
Do TikTok Shop products stay on the bestseller chart all quarter?
Mostly they do not. Of 37 products that reached a monthly Top 20 position during Q4 2025, only 6 held a position in all three months. Twenty-three appeared in exactly one month. Planning around a product that keeps selling for a full quarter means planning against the base rate.
Is November or December the bigger month on TikTok Shop?
It depends on the category. Of 17 categories analyzed, 13 peaked in December and 4 peaked in November. The November group is Beauty & Personal Care, Womenswear & Underwear, Home Improvement and Health. Beauty in particular skews early: the top product of the quarter did 69% more GMV in November than in December.
What commission rate should I set for Q4?
Set it by what a creator earns per unit, not by the percentage. Among the Q4 2025 top 10, commission ranged from 5% to 25%, and the highest-GMV items were spread across that whole range. A 5% rate on a $600 electric bike pays a creator $30 per sale, which is double what 25% of a $15 supplement pays.
Does FastMoss have a discount code?
Yes. The current FastMoss promo code is NEW000. Enter it at checkout on fastmoss.com to apply your new-user discount. FastMoss is a TikTok Shop analytics platform that tracks real-time GMV, category rankings, creator performance, and top-selling products — the data source behind this guide.
🎯 Find Your Next Breakout Product
FastMoss tracks every TikTok Shop product in real-time — see today’s velocity leaders before they hit your competitors’ radar.